
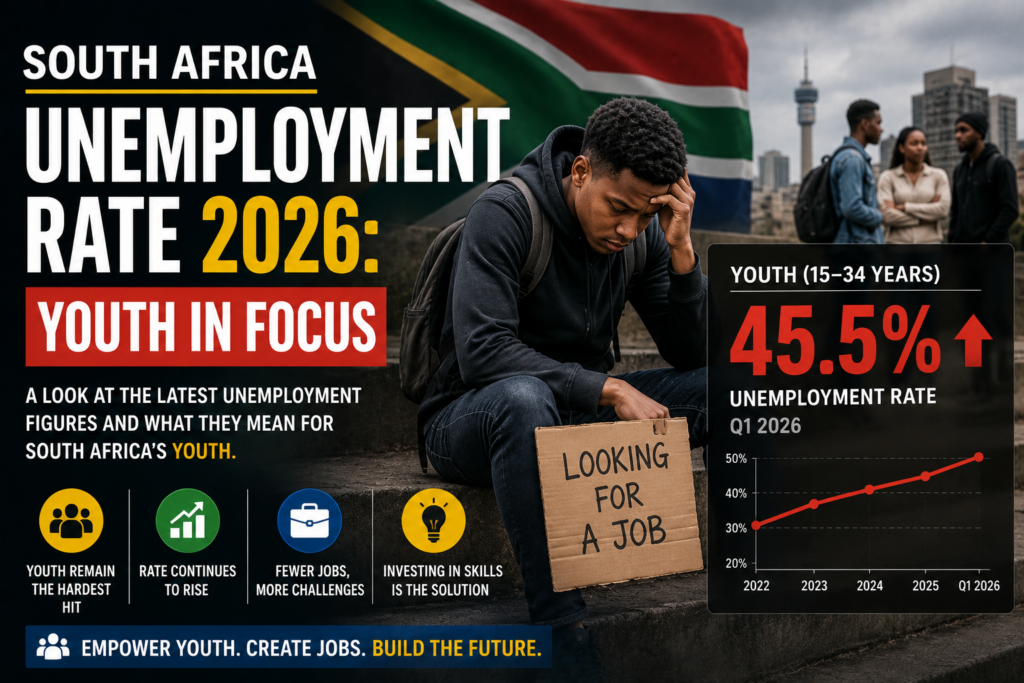
South Africa’s official unemployment rate rose to 32.7% in the first quarter of 2026, up 1.3 percentage points from 31.4% in the final quarter of 2025, according to Statistics South Africa’s Quarterly Labour Force Survey (QLFS). The number of employed people fell by 345,000 to 16.8 million, while the number of unemployed people rose by 301,000 to 8.1 million. Youth unemployment, already the more alarming figure in most releases, climbed 2.0 percentage points to 45.8%.
What the QLFS actually measures
Unlike the Quarterly Employment Statistics (QES) survey, which counts jobs on formal employer payrolls — covered in our report on South Africa’s formal job losses in early 2026 — the QLFS is a household survey that asks individuals directly about their employment status. This makes it the source of South Africa’s official, most widely cited unemployment rate, and it captures informal and formal work alike, along with people who have stopped actively looking for work and therefore fall outside the “official” unemployed count under the strict definition used internationally.
The numbers in context
- Overall unemployment rate: 32.7%, up from 31.4% the previous quarter.
- Employed persons: fell by 345,000 to 16.8 million.
- Unemployed persons: rose by 301,000 to 8.1 million.
- Youth (15–34) unemployment: rose to 45.8%.
A rate above 32% means close to one in three people in the labour force — that is, people who are working or actively seeking work — did not have a job in the quarter measured. For young people specifically, the rate approaching 46% means nearly half of economically active youth were without work.
Why youth unemployment is a distinct and deeper problem
Youth unemployment in South Africa has consistently run well above the national average for years, reflecting a combination of factors: a mismatch between the skills school-leavers and graduates hold and what employers are hiring for, limited entry-level job creation in a slow-growing economy, and the practical difficulty many young people face in gaining the “first job” experience that opens doors to further employment. Our opinion piece, South Africa’s youth unemployment crisis needs more than another skills programme, examines whether current policy tools are equal to a problem of this scale.
What’s driving the deterioration
The QLFS release does not attribute the change to a single cause, but it lands alongside other economic data pointing to the same underlying pressures: formal job losses reported in the QES survey for the same quarter, and interest rate increases that raise borrowing costs for businesses considering hiring. None of these figures moves in isolation — they reflect the same underlying economy, viewed through different statistical lenses.
What this means for households and policymakers
A rising unemployment rate has knock-on effects well beyond the individuals directly affected — it increases demand for social grants, including the SRD grant, adds pressure on extended family networks that often support unemployed relatives, and factors into government’s fiscal planning, since a smaller share of the population in formal employment also means a narrower base of taxpayers funding public services. For context on how grant policy is responding to these pressures, see our report on SASSA’s 2026 grant increases and the frozen SRD grant.
Background: how unemployment is defined and measured
South Africa’s official unemployment rate uses the “narrow” definition, counting only people who are not working but are actively seeking work and available to start. An “expanded” definition, which also includes people who have given up actively searching (sometimes called discouraged work-seekers), typically produces an even higher rate. Stats SA publishes both measures in its full QLFS release for readers wanting the fuller picture.
What happens next
The next QLFS release will show whether Q1 2026’s deterioration continued or reversed. Given how closely unemployment, inflation and interest rate decisions are linked in South Africa’s current economic cycle, any further softening in the jobs data is likely to feature in the Reserve Bank’s future rate decisions and in Treasury’s fiscal planning.
Provincial and demographic variation behind the headline rate
South Africa’s unemployment rate is never evenly distributed across the country. Provinces with more diversified, urban economies — Gauteng and the Western Cape, typically — tend to report lower unemployment rates than provinces more dependent on agriculture, mining, or historically underdeveloped former homeland areas, such as the Eastern Cape and Limpopo. Unemployment also varies significantly by education level, with holders of tertiary qualifications facing meaningfully lower unemployment rates than those without a matric certificate, though even graduate unemployment in South Africa remains higher than in many comparable economies. These variations mean the national headline figure, while useful for tracking overall trends, can mask very different lived realities depending on where in the country, and with what level of education, a particular job seeker is searching.
Why “narrow” and “expanded” unemployment definitions matter
The officially reported 32.7% figure uses the narrow definition, which excludes people who want work but have stopped actively searching — often because they’ve concluded, based on past experience, that searching is unlikely to succeed. Stats SA’s expanded unemployment definition, which includes these discouraged work-seekers, consistently produces a considerably higher rate than the narrow measure. Understanding which definition is being cited matters for interpreting any unemployment statistic accurately, since headlines don’t always specify which measure they’re referring to, and the gap between the two can be substantial.
What the employment absorption rate adds to the picture
Beyond the unemployment rate itself, Stats SA also tracks the employment absorption rate — the share of the total working-age population that is actually employed, regardless of whether the rest are classified as unemployed or not economically active. A low absorption rate, particularly among youth, signals that the challenge extends beyond simply matching active job-seekers to available jobs; it points to a large share of the working-age population not meaningfully engaged in the labour market at all, which is a broader and, in some ways, more concerning indicator than the unemployment rate alone.
What businesses say drives their hiring caution
Surveys of South African businesses have repeatedly cited a combination of factors behind hiring caution: policy and regulatory uncertainty, the cost and complexity of retrenchment processes if a hire doesn’t work out, electricity and logistics reliability affecting operational planning, and simply weak demand growth reducing the need for additional staff. Addressing unemployment at scale generally requires progress on several of these fronts simultaneously, since improving only one — for example, energy reliability, which has improved substantially — does not automatically resolve hiring caution driven by other factors.
What “narrow” unemployment still misses about informal work
South Africa’s official employment figures do capture informal sector work, but measuring informal economic activity accurately is inherently harder than measuring formal payroll employment, given the absence of the paper trail formal employment generates. Some economists argue this means both employment and unemployment figures should be read with an awareness that informal economic activity — spaza shops, informal trading, casual and piece work — plays a meaningful cushioning role for many households that isn’t always fully visible in headline statistics.
Frequently asked questions
What’s the difference between the QLFS and QES unemployment figures?
The QLFS is a household survey producing the official unemployment rate; the QES is an employer survey measuring formal jobs on payrolls. They use different methods and can move somewhat differently quarter to quarter, though both have pointed toward labour market weakness in 2026.
Why is youth unemployment so much higher than the overall rate?
Young people typically face greater barriers entering the labour market for the first time, including limited work experience and a mismatch between available skills and employer demand, which tends to push youth unemployment well above the national average in South Africa.
Sources Used
- Statistics South Africa — Quarterly Labour Force Survey, Q1 2026